- Report Overview
- GPU Market Trends — RTX 5070 Holds Top Spot for 7 Consecutive Months; Radeon Also Expands Share —
- CPU Market Trends — Ryzen 7 9800X3D Leads for 5 Consecutive Months; 9700X and 5700X Also See Significant Growth —
- Configuration (GPU × CPU) Market Trends — Top Configuration Holds for 3 Consecutive Months; “RTX 5070 × Ryzen 7 9700X” Sees Significant Rise —
- Price Range Market Trends — 200,000 Yen Range Maintains Lead; 300,000 Yen Range Also Exceeds 30%, Indicating Focus on Realistic High-Performance Tiers —
- July 2026 Popular Product Ranking TOP10
- Manufacturer Attention Ranking TOP5 — Frontier Takes First Place; MDL Enters TOP5 for the First Time —
- About gg
- Operation Information
Report Overview
-
Aggregation Period: July 1, 2026 (Wednesday) to July 31, 2026 (Friday)
-
Target: Products listed on the gaming PC search site “gg” (https://good-gamers.jp)
-
Aggregation Content: User search behavior data
-
Market Price: Referenced from the “Gaming PC Price Check Tool” (https://good-gamers.jp/market/)
Please note: Price data is from the current month and may differ from current prices. This data does not represent purchase numbers or sales performance, but rather relative attention (interest) during the specified period. Due to changes in data acquisition methods at the end of May 2026, direct comparison with figures prior to May 2026 should be done with caution. Market prices and the number of listed models are as of the publication of this press release. When quoting or reprinting, please credit “Gaming PC search site gg (https://good-gamers.jp)” as the source.
GPU Market Trends — RTX 5070 Holds Top Spot for 7 Consecutive Months; Radeon Also Expands Share —
In July 2026, “RTX 5070” maintained its leading position in GPU browsing trends with 26.0% share, an increase of +1.5 percentage points from the previous month’s 24.5%. This marks its seventh consecutive month at number one since January 2026.
The “RTX 5070 Ti” ranked second with 16.4%, a decrease of -2.3 percentage points from the previous month. Despite this, the top two models, RTX 5070 and RTX 5070 Ti, collectively accounted for 42.4% of the share, indicating that the RTX 5070 series remains central to gaming PC choices.
Conversely, Radeon models saw an increase in share: “RX 9070 XT” rose to 12.2% (+1.9 percentage points) and “RX 9060 XT (16GB)” reached 11.2% (+3.1 percentage points). Notably, “RX 9060 XT (16GB)” showed the largest share growth among the top five this month.
The combined share of these two Radeon models increased by 5.0 percentage points, from 18.4% last month to 23.4%. While GeForce remains dominant, it suggests that more users are considering Radeon-equipped models, comparing prices, VRAM capacity, and gaming performance.
“RTX 5060” also entered the top five at 8.1%. July was a month where comparison extended across a broad range of performance tiers, from mid-range to high-end GPUs, rather than solely focusing on top-tier options.
GPU Attention Ranking TOP5
| Rank | GPU | Current Month Share | Previous Month Share | Share Difference |
|---|---|---|---|---|
| 1st | RTX 5070 | 26% | 24.5% | +1.5pt |
| 2nd | RTX 5070 Ti | 16.4% | 18.7% | -2.3pt |
| 3rd | RX 9070 XT | 12.2% | 10.3% | +1.9pt |
| 4th | RX 9060 XT (16GB) | 11.2% | 8.1% | +3.1pt |
| 5th | RTX 5060 | 8.1% | 7% | +1.1pt |
CPU Market Trends — Ryzen 7 9800X3D Leads for 5 Consecutive Months; 9700X and 5700X Also See Significant Growth —
In the CPU category, “Ryzen 7 9800X3D” took the top spot with 26.4% share. Although it saw a slight decrease of -1.3 percentage points from the previous month, it has maintained the number one position for five consecutive months since rising to the top in March 2026.
“Ryzen 7 7800X3D” came in second with 16.4%, an increase of +1.4 percentage points. The combined share of these top two X3D series CPUs was 42.8%, nearly on par with the previous month’s 42.7%, indicating continued strong interest in X3D series CPUs among users prioritizing gaming performance.
Significantly, “Ryzen 7 9700X” and “Ryzen 7 5700X” saw substantial growth in July. Ryzen 7 9700X increased by +5.1 percentage points to 15.6% (3rd place), and Ryzen 7 5700X increased by +4.3 percentage points to 14.8% (4th place). Their combined share reached 30.4%, suggesting that interest is expanding not only to the high gaming performance of X3D series but also to regular models that offer a good balance of price and performance.
“Ryzen 7 7700” followed in fifth place with 6.3%, meaning all top five models were from the Ryzen series again this month. The total share of the top five was 79.5%, solidifying the AMD Ryzen 7 series as the central choice for CPU comparisons within ‘gg’.
CPU Attention Ranking TOP5
| Rank | CPU | Current Month Share | Previous Month Share | Share Difference |
|---|---|---|---|---|
| 1st | Ryzen 7 9800X3D | 26.4% | 27.7% | -1.3pt |
| 2nd | Ryzen 7 7800X3D | 16.4% | 15% | +1.4pt |
| 3rd | Ryzen 7 9700X | 15.6% | 10.5% | +5.1pt |
| 4th | Ryzen 7 5700X | 14.8% | 10.5% | +4.3pt |
| 5th | Ryzen 7 7700 | 6.3% | 6.7% | -0.4pt |
Configuration (GPU × CPU) Market Trends — Top Configuration Holds for 3 Consecutive Months; “RTX 5070 × Ryzen 7 9700X” Sees Significant Rise —
In terms of configurations, “RTX 5070 Ti × Ryzen 7 9800X3D” ranked first with 11.2% share. Despite a decrease of -2.4 percentage points from the previous month, it has maintained the top position for three consecutive months since May 2026.
“RX 9070 XT × Ryzen 7 9800X3D” secured second place with 8.2%, an increase of +1.1 percentage points. This high-performance combination, featuring the top-ranked Ryzen 7 9800X3D CPU and the growing RX 9070 XT GPU, continues to attract significant attention.
The most substantial growth was seen in the third-ranked configuration, “RTX 5070 (12GB) × Ryzen 7 9700X”. Its share increased from 3.9% last month to 7.9%, a rise of +4.0 percentage points. This combination of the top-ranked RTX 5070 GPU and the significantly growing Ryzen 7 9700X CPU is emblematic of user trends in July.
“RTX 5070 (12GB) × Ryzen 7 7800X3D” followed in fourth place with 6.6%, and “RTX 5060 (8GB) × Ryzen 7 5700X” in fifth with 4.7%.
Configuration Attention Ranking TOP5
| Rank | Configuration | Current Month Share | Previous Month Share | Share Difference |
|---|---|---|---|---|
| 1st | RTX 5070 Ti × Ryzen 7 9800X3D | 11.2% | 13.6% | -2.4pt |
| 2nd | RX 9070 XT × Ryzen 7 9800X3D | 8.2% | 7.1% | +1.1pt |
| 3rd | RTX 5070 (12GB) × Ryzen 7 9700X | 7.9% | 3.9% | +4.0pt |
| 4th | RTX 5070 (12GB) × Ryzen 7 7800X3D | 6.6% | 8.1% | -1.5pt |
| 5th | RTX 5060 (8GB) × Ryzen 7 5700X | 4.7% | 2.8% | +1.9pt |
Price Range Market Trends — 200,000 Yen Range Maintains Lead; 300,000 Yen Range Also Exceeds 30%, Indicating Focus on Realistic High-Performance Tiers —
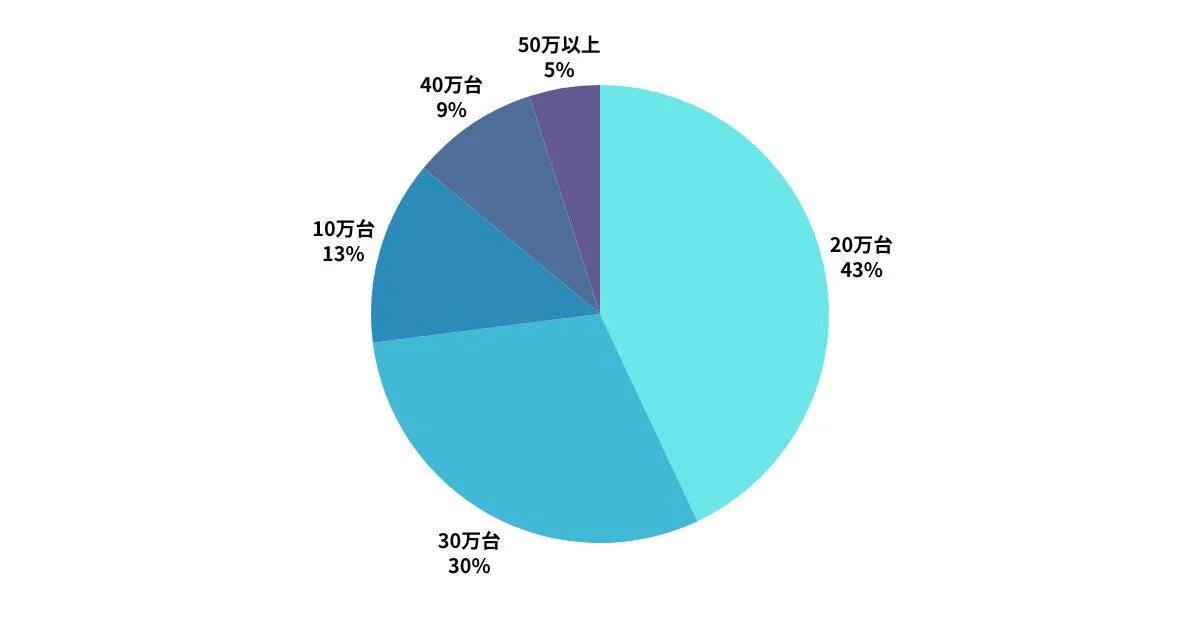
In the price range category, the “200,000 yen range” maintained its top position with 42.5% share. It showed the largest growth among all price ranges, increasing by +6.8 percentage points from the previous month’s 35.7%.
The “300,000 yen range” was second with 30.2%, a slight decrease of -1.6 percentage points from the previous month. However, the combined share of the 200,000 yen and 300,000 yen ranges reached 72.7%, indicating that over 70% of users comparing gaming PCs are interested in these two price brackets.
| Price Range | Current Month Share | Previous Month Share | Share Difference |
|---|---|---|---|
| 100,000 yen range | 12.8% | 13.6% | -0.8pt |
| 200,000 yen range | 42.5% | 35.7% | +6.8pt |
| 300,000 yen range | 30.2% | 31.8% | -1.6pt |
| 400,000 yen range | 9.2% | 9.8% | -0.6pt |
| 500,000 yen or more | 5.3% | 9.1% | -3.8pt |
July 2026 Popular Product Ranking TOP10
The most notable gaming PC in July 2026 was MDL’s “Ryzen7 7800X3D × RX 9060 XT 16GB”. The combination of a CPU focused on gaming performance and a cost-effective GPU with 16GB of VRAM garnered broad user interest.
OZgaming’s “【Z1 Cost-Performance Model】Ryzen7 9700X・RTX5070” ranked second. The configuration “RTX 5070 × Ryzen 7 9700X” also saw a significant increase of +4.0 percentage points in the configuration ranking, directly reflecting the heightened interest in this spec combination in July.
Astromeda’s “Ryzen 7 9800X3D × RX 9070 XT Gaming PC BTO” entered the ranking at third place. This marks Astromeda’s first time in the Popular Product TOP10 since the monthly report’s inception.
Furthermore, Frontier’s products ranked from 5th to 8th, with four models appearing consecutively. This indicates that attention was distributed across multiple sale-eligible models, suggesting that Frontier’s overall product lineup was widely compared.
| Rank | Manufacturer | Product Name |
|---|---|---|
| 1st | MDL | Ryzen7 7800X3D × RX 9060 XT 16GB |
| 2nd | OZgaming | 【Z1 Cost-Performance Model】 Ryzen7 9700x・RTX5070 (Discontinued) |
| 3rd | Astromeda | Ryzen 7 9800X3D × RX 9070 XT Gaming PC BTO |
| 4th | Dospara | THIRDWAVE AD-R7A57A-01W Ryzen7 7700 equipped 『Minecraft: Java & Bedrock Edition for PC, PC Game Pass Bundled Edition』 |
| 5th | Frontier | FRGHLMB650/WS0531 |
| 6th | Frontier | FRGHLMB650/WS0309 (Discontinued) |
| 7th | Frontier | FRGHLMB650/WS0616 (Discontinued) |
| 8th | Frontier | FRMFGB650/WS525 |
| 9th | MDL | Ryzen7 5700X × RTX 5060 |
| 10th | OZgaming | 【Z1 Cost-Performance Model】 Ryzen7 7800x3D・RTX5070 (Discontinued) |
Manufacturer Attention Ranking TOP5 — Frontier Takes First Place; MDL Enters TOP5 for the First Time —
In the manufacturer ranking, “Frontier” secured the top spot. Its appearance with four products from 5th to 8th place in the popular product ranking indicates that broad attention across multiple products contributed to its overall manufacturer ranking.
“OZgaming” ranked second, and “MDL” entered the top five for the first time since the monthly report began in December 2025, taking third place.
MDL commenced a 10,000 yen discount coupon distribution for all its products starting in July 2026. This increased price competitiveness likely led to more users comparing and browsing their listed products, contributing to the rise in overall manufacturer attention.
| Rank | Manufacturer | Month-over-month difference |
|---|---|---|
| 1st | Frontier | ↑3 |
| 2nd | OZgaming | ↓1 |
| 3rd | MDL | +5 |
| 4th | Dospara | ↓1 |
| 5th | STORM | ↓3 |
About gg
“Good choices for all gamers.”
‘gg’ is a search site that allows users to compare gaming PCs and BTO PCs across various manufacturers. Users can narrow down products by detailed criteria such as price, GPU, CPU, memory, and storage to find the optimal gaming PC that fits their budget and needs.
The site also reflects the latest sales and coupon information from manufacturers like Dospara and Mouse Computer daily. By updating specs and price information, ‘gg’ provides an environment where users can compare the latest information and find their recommended gaming PC.
Operation Information
-
Company Name: G.K. Kidukeba
-
Representative: Kanta Fukuda
-
Corporate Site: https://kidukeba.co.jp/
-
Gaming PC/BTO Search Site “gg”: https://good-gamers.jp/
-
Gaming PC Coupon/Sale Information Media “iyabuzz”: https://eb.good-gamers.jp/
-
Email: k_fukuda@kidukeba.co.jp
-
Tel: 050-1726-3811
-
Related Link: https://kidukeba.co.jp/archives/724